WP Engine scored 9.57 out of 10 on performance with 355 ms TTFB, 100% uptime and 65 ms global TTFB. Even though the host delivers the fastest speed globally, it costs $27/month and renews at $35/month, which is 7x more than most budget hosts. WP Engine’s TTFB has improved significantly from 463 ms in 2024 to 355 ms across our current window. In this review, we will look into all the performance metrics, pricing, and features of WP Engine. Most importantly, we will explain who should choose WP Engine and who should avoid it.
HostingStep earns commissions from hosting purchases made through our links. This does not affect our rankings or test results. We purchase all hosting accounts with our own funds. No hosting company has paid for placement or influenced our test results. For this review, we used the hostname, hostperf-wpe.com with the Pingdom check ID, 6622690. We conducted 3,011,040 individual TTFB and uptime checks across 6+ years of monitoring, including 349,920 checks in our current window of October 1, 2025 to May 31, 2026. Additional tests include Load test using Loader.io, Global speed test in over 40 cities using SpeedVitals, and WPBenchmark for raw hardware strengths.
Note: This review is based on our testing of WP Engine’s Startup plan. The performance figures are measured data; the recommendations reflect our editorial assessment of those results. Unless stated otherwise, everything here applies to the Startup plan while other WP Engine plans may produce different benchmark results.
Performance Overview
| Metric | Result | Score (/10) |
| TTFB (US) | 355ms | 9.25 |
| Response consistency | 259–526ms (spike ratio 1.48) | — |
| Uptime | 100.0000% (0 outages) | 10.00 |
| Load Test | 27ms / 0.00% error | 10.00 |
| Global TTFB (cached, 40 cities) | 65ms | 10.00 |
| Server Hardware (WPBench) | 6.5 | 6.50 |
| Performance Score | 9.57 / 10 |
WP Engine scored 9.57 out of 10 on performance, with excellent scores in all the performance metrics except for WPBench where it scored 6.5 out of 10. The performance score is determined by the host’s results on TTFB (US), Uptime, Load Test, Global TTFB, and Server Hardware (WPBench).
In all the four speed and reliability metrics, WP Engine scored between 9.25 and 10 with a TTFB of 355 ms, Uptime of 100%, Load handling of 27 ms with 0% errors, and a global TTFB of 65 ms but the host only scored poorly on hardware with 6.5, which is below average.
TTFB Response Time
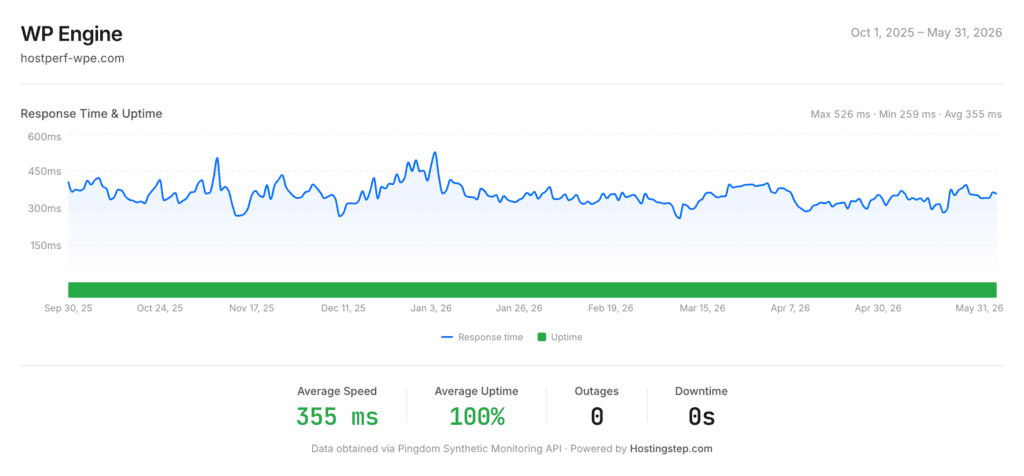
WP Engine recorded an average response time of 355 ms in the TTFB (US) test across our 8-month window from October 1, 2025 to May 31, 2026, scoring 9.25 out of 10. TTFB directly impacts LCP (Largest Contentful Paint), which is a Google ranking factor, making this metric more important than just pure user experience. If we consider the last 5 years TTFB historical trend, the host recorded the best TTFB of 360 ms in 2021.
The TTFB deteriorated slightly in 2022 with 388 ms, but the TTFB deteriorated significantly in 2023 and 2024 with 414 ms and 463 ms respectively, which is like 29% degradation. However, our current data shows excellent improvement in TTFB with 355 ms, which is a 23% improvement from the 2024 levels.
Unlike other hosts that showed steady degradation year on year without any correction, WP Engine’s historical data indicates that the team has been constantly identifying problems and fixing them as well. This signals the platform’s maturity. Not only have the numbers improved but the problems have been resolved fully as well.
The current TTFB is well under the 800 ms threshold Google treats as a good server response time under Core Web Vitals. Hence, the story of WP Engine’s TTFB is of a significant decline followed by a significant recovery. When compared with the competitors, Pressable is faster with 320 ms, but WP Engine beats Kinsta with 355 ms vs 475 ms.
While the field median TTFB is approximately 465 ms, WP Engine is 24% faster than the field median with 355 ms, and 35 ms behind Pressable with 320 ms. Across the window WP Engine’s response time stayed inside a 259–526 ms range, a spike ratio of 1.48 against its own average. A steady response matters as much as a fast one, because occasional stalls hide behind a good average and destabilise Core Web Vitals. A TTFB of 355ms means your server begins to respond in roughly a third of a second after receiving a request. This baseline speed is adequate for WordPress sites with dynamic content, WooCommerce stores, and membership sites. With this speed, the pages start rendering quickly even before plugins and themes add their own loading time.
| Year | Avg TTFB | Uptime | Days Mon. | Tests | Outages | Downtime |
| 2020 | 365ms | 99.94% | 116 | 167,040 | 10 | 95 min |
| 2021 | 360ms | 99.98% | 365 | 525,600 | 5 | 104 min |
| 2022 | 388ms | 99.99% | 364 | 524,160 | 4 | 25 min |
| 2023 | 414ms | 99.98% | 365 | 525,600 | 6 | 116 min |
| 2024 | 463ms | 99.99% | 366 | 527,040 | 3 | 42 min |
| 2025 | 365ms | 99.99% | 364 | 524,160 | 1 | 25 min |
Uptime
WP Engine recorded 100.0000% uptime across our 8-month window with a perfect score of 10 out of 10, zero outages and zero downtime. However, as we consider the 2025 full year, we did find 1 outage of 25 minutes total downtime, making it a 99.99% uptime. The best part is that the host has maintained good uptime consistency for the past 5 years with the uptime never going below 99.94%.
- 100.00% = 0 minutes of downtime per year (WP Engine’s result across our 8-month window)
- 99.99% = ~53 minutes of downtime per year
- 99.97% = ~2.6 hours of downtime per year
- 99.95% = ~4.4 hours of downtime per year
As we look at the annual outage count, it shows a clear story: 10 → 5 → 4 → 6 → 3 → 1, followed by zero outages across our current window from October 1, 2025 to May 31, 2026. The numbers tell us how the host has systematically reduced its failure frequency over six years of monitoring.
While 2025 is the best year with 1 outage and 25 minutes of downtime, 2020 was the worst year with 10 outages and 95 minutes of downtime even though we started monitoring from a partial year in 2020. Things started getting better from 2022 with 4 outages and 25 minutes of downtime.
WP Engine’s 100% uptime across our 8-month window is the top score achieved and only Pressable matches this standard. While a 99.99% uptime technically means 53 minutes of downtime per year, WP Engine’s 2025 actual downtime of 25 minutes is roughly half of that. The host offers a 99.99% uptime SLA on Core and Enterprise tiers and not on the Startup plan that we tested. However, despite no formal SLA on the Startup plan, the actual uptime it delivers exceeds what many hosts guarantee.
Load Handling
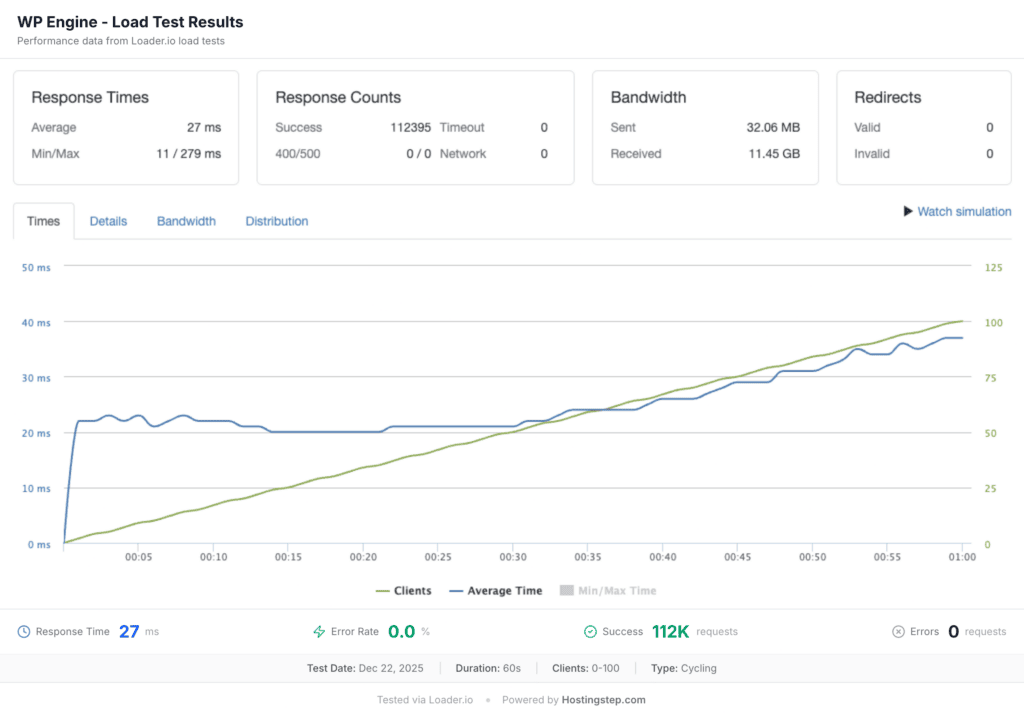
WP Engine recorded an average response time of 27 ms/0% errors under a load of 100 concurrent users in 60 seconds, scoring 10 out of 10. We test the load handling capacity of WP Engine by using Loader.io to send 100 concurrent users to the site in 60 seconds. We then monitor how fast or slow the site responds to the traffic and the error rate it experiences during the traffic spike.
A 0% error means zero failed requests under concurrent load and the server handled every single request. Pressable leads with 12 ms/0% errors, with WP Engine close behind.
WP Engine’s excellent load handling has to do a lot with its EverCache technology, and Cloudflare edge CDN. Practically, what 27 ms/0% error means is that if ever your site goes viral or experiences a traffic spike, WP Engine will handle the traffic efficiently to keep your site up and running. In case of a WooCommerce flash sale, all visitors get served without errors. Even when Google’s crawler hits the site during peak hours, there will be zero impact on other visitors. This is the exact performance that a managed hosting premium should deliver and WP Engine delivers it.
Server Hardware
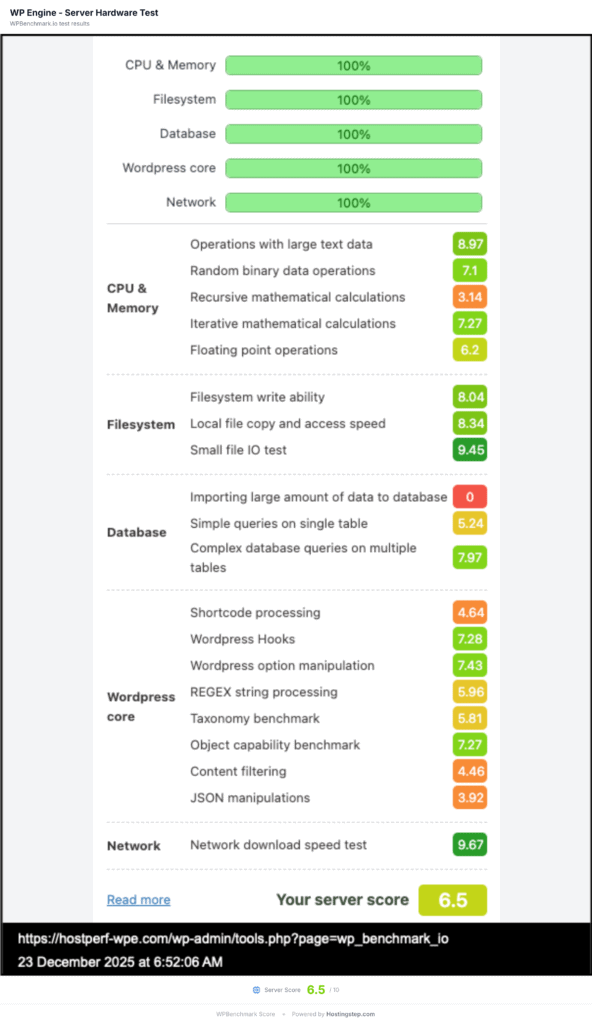
WP Engine secured a WPBench score of 6.5 out of 10. Pressable scored slightly better than WP Engine with 6.7. WPBench measures CPU, RAM, and disk I/O allocation and not web server software type. WP Engine’s low WPBench score of 6.5 indicates raw resources restriction on the Startup, which is a deliberate trade off.
However, WP Engine compensates for this weakness with edge CDN, and aggressive caching so that the speed remains Elite despite limited origin server resources. Sites with heavy database queries, complete WooCommerce stores or plugin heavy sites may hit the resource limit and experience lag.
The 6.5 does not matter in case of anonymous visitors since the host will serve cached pages using its edge CDN with the visitors never touching the origin server hardware. However, the score does matter in WordPress admin dashboard, WooCommerce cart and checkout pages since these are uncached dynamic pages. It also does matter in case of search queries, logged in user sessions and sites with over 20 plugins generating complex database queries.
While WP Engine’s hardware allocation doesn’t really stand out, its edge caching architecture does a great job in delivering excellent speed to most visitors since they never have to interact with the origin server directly. The score only matters most for admin dashboard and uncached dynamic pages performance.
Global TTFB
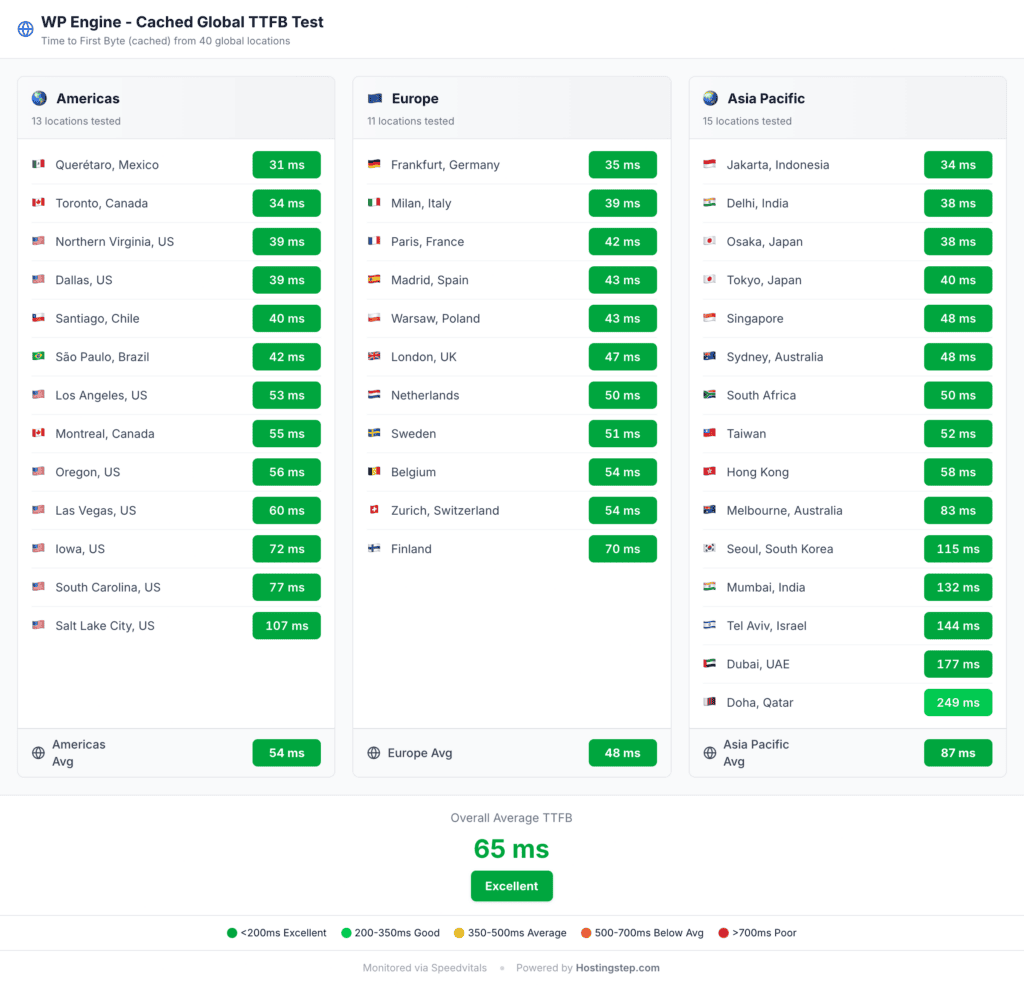
We tested WP Engine’s global average response time across America, Europe, and Asia Pacific in over 40 cities using SpeedVitals. The host recorded an average cached Global TTFB of 65 ms. This performance is possible because of WP Engine’s edge CDN, which delivers content from the nearest edge node instead of the origin server.
Americas – 54ms Average
Querétaro 31ms, Toronto 34ms, Northern Virginia 39ms, Dallas 39ms, Santiago 40ms, São Paulo 42ms, Los Angeles 53ms, Montreal 55ms, Oregon 56ms, Las Vegas 60ms, Iowa 72ms, South Carolina 77ms, Salt Lake City 107ms
Europe – 48ms Average
Frankfurt 35ms, Milan 39ms, Paris 42ms, Madrid 43ms, Warsaw 43ms, London 47ms, Netherlands 50ms, Sweden 51ms, Belgium 54ms, Zurich 54ms, Finland 70ms
Asia Pacific – 87ms Average
Jakarta 34ms, Delhi 38ms, Osaka 38ms, Tokyo 40ms, Singapore 48ms, Sydney 48ms, South Africa 50ms, Taiwan 52ms, Hong Kong 58ms, Melbourne 83ms, Seoul 115ms, Mumbai 132ms, Tel Aviv 144ms, Dubai 177ms, Doha 249ms
The average response time in the Americas is 54 ms with the fastest TTFB of 31 ms in Querétaro and the highest of 107 ms in Salt Lake City. The TTFB is exceptional across all of North America and every Latin American city stays under 45ms.
WP Engine recorded an average cached global TTFB of 48 ms in Europe with the fastest TTFB of 35 ms in Frankfurt and the highest of 70 ms in Finland. The TTFB of 48 ms in Europe is remarkable with most hosts recording an average TTFB between 400 to 600ms for European visitors. Frankfurt at 35ms is faster than many hosts’ US-only TTFB.
The host recorded a slightly higher yet excellent average cached global TTFB in Asia Pacific with 87 ms, the fastest reading being 34 ms in Jakarta and the highest 249 ms in Doha. Sydney at 48 ms and Melbourne at 83 ms mean Australian visitors are served from the edge rather than across the Pacific. Only the Middle East readings sit meaningfully above the regional average, with Dubai at 177 ms and Doha at 249 ms. An average of 87ms in Asia Pacific is dramatically better than that of most hosts. For example: Kinsta recorded a global average of 477ms and SiteGround recorded 1,200ms.
WP Engine’s exceptional global TTFB average is possible because of its Cloudflare Enterprise integration, which serves full-page cached HTML from over 330 edge locations worldwide. WP Engine’s edge CDN serves complete page responses from the nearest edge nodes, which makes it different from static CDNs that only cache images and CSS. The architecture truly justifies the premium pricing with exceptional global performance, which origin only hosts can’t match.
WP Engine vs Competitors
| Metric | WP Engine | Kinsta | Hostinger Business | Bluehost | SiteGround | Pressable | Rocket.net |
| Performance Score | 9.57 | 8.30 | 8.35 | 8.45 | 5.59 | 9.66 | 7.02 |
| TTFB | 355ms | 475ms | 438ms | 498ms | 745ms | 320ms | 346ms |
| TTFB Score | 9.25 | 7.75 | 8.00 | 7.25 | 3.75 | 9.50 | 9.50 |
| Uptime | 100.0000% | 99.9880% | 99.9894% | 99.9900% | 99.9695% | 100.0000% | 99.9703% |
| Load Test | 27ms/0% | 40ms/0% | 31ms/0% | 41ms/0% | 170ms/0% | 12ms/0% | Blocked |
| Load Score | 10.0 | 9.0 | 9.0 | 9.0 | 6.0 | 10.0 | 0.0 |
| Global TTFB | 65ms | 477ms | 351ms | 224ms | 1,200ms | 74ms | 66ms |
| Global Score | 10 | 6 | 7 | 8 | 3 | 10 | 10 |
| WPBench | 6.5 | 8.8 | 7.4 | 9.6 | 8.4 | 6.7 | 7.5 |
| CDN | Edge | Edge | Static | Static | Addon | Edge | Edge |
| None | None | Addon | Addon | Included | Addon | None | |
| Backups | Daily | Daily | Daily | Weekly | Daily | Daily | Daily |
| Intro Price | $27/mo | $30/mo | $3.69/mo | $1.99/mo | $3.99/mo | $20.83/mo | $25/mo |
| Renewal | $35/mo | — | $16.99/mo | $8.99/mo | $17.99/mo | — | — |
WP Engine vs Kinsta
WP Engine wins on TTFB with 355 ms vs 475 ms, uptime with 100% vs 99.99%, global TTFB with 65 ms vs 477 ms, load test with 27 ms vs 40 ms, and also on price with $27 vs $30. Kinsta, on the other hand, wins only on WPBench score with 8.8 vs 6.5. You should choose WP Engine if you prioritise speed, global reach, and uptime at a slightly lower price than Kinsta.
You should choose Kinsta over WP Engine if only you need higher raw server resources for complex databases sites or plugin heavy sites. Read WP Engine Vs Kinsta
WP Engine vs Hostinger Business
WP Engine wins on TTFB with 355 ms vs 438 ms, Uptime with 100% vs 99.99%, load test with 27 ms vs 31 ms, global TTFB with 65 ms vs 351 ms, and CDN type with edge vs static. Hostinger Business, on the other hand, wins on price $3.69 vs $27, WPBench with 7.4 vs 6.5.
You can choose WP Engine if your need for maximum speed and performance justifies the 7x price premium. You should choose Hostinger if you want strong performance at a cost much lower than that of WP Engine and you don’t need edge CDN or managed WordPress infrastructure.
Most importantly, WP Engine costs $1,164 over three years at $27 for the first year then $35 on renewal, which is $712 more than Hostinger Business at $452 based on its $3.69 intro and $16.99 renewal. Read Hostinger Review
WP Engine vs Bluehost
WP Engine wins on TTFB with 355 ms vs 498 ms, Uptime with 100% vs 99.99%, Load handling with 27 ms/0% vs 41 ms/0%, and global TTFB with 65 ms vs 224 ms. Bluehost wins on price with $1.99 vs $27, WPBench with 9.6 vs 6.5.
You can choose WP Engine if you need a strong performance and your budget allows the premium. You should choose Bluehost if you need maximum server resources on a budget for WooCommerce stores and plugin heavy sites. Read Bluehost Review
WP Engine vs SiteGround
WP Engine wins on TTFB with 355 ms vs 745 ms, Uptime with 100% vs 99.97%, Load handling with 27 ms vs 170 ms, and global TTFB with 65 ms vs 1,200 ms. SiteGround, on the other hand, wins on price with $3.99 vs $27, WPBench with 8.4 vs 6.5.
You can choose WP Engine if you need excellent delivery speed, perfect uptime, and global reach and you are okay with the price. You can choose SiteGround if you need email hosting included for no extra charges and are on a tight budget but also understand the performance trade off it comes with. Read SiteGround Review
WP Engine vs Pressable
WP Engine wins global TTFB with 65 ms vs 74 ms. Pressable, on the other hand, wins on TTFB with 320 ms vs 355 ms, load test with 12 ms vs 27 ms, and price with $20.83 vs $27.
The two hosts are now effectively level on global delivery at 65 ms vs 74 ms, so the decision comes down to US response time and price. You can choose Pressable if you want the best overall package at a lower price with $20.83 vs $27 but with higher US speed.
WP Engine’s global TTFB is 12% faster than that of Pressable with 65 ms vs 74 ms, a gap small enough that no visitor will notice it. Read Pressable Review
WP Engine vs Rocket.net
Both hosts offer premium managed WordPress for the same price tier and both feature edge CDN. However, WP Engine wins on Uptime with 100% vs 99.97% and on load handling, where Rocket.net blocked our load test benchmark. Rocket.net, on the other hand, is marginally faster on TTFB with 346 ms vs 355 ms, wins on hardware with 7.5 vs 6.5, and is slightly cheaper with $25 vs $27.
Rocket.net blocked our load test benchmark, so we have no load-handling data for them. Without that data we can’t recommend them over WP Engine even though both hosts belong to the same price tier and have the same features. You can choose WP Engine for every scenario when you are considering Rocket.net. Read Rocket.net Review
Who Should Use WP Engine
Sites that depend on international traffic should choose WP Engine, as the host recorded 65 ms global TTFB, indicating consistent fast loads worldwide, combined with the edge CDN to handle traffic spikes reflected by 27 ms under 100 concurrent users. WP Engine delivers a cached average of 87 ms in Asia Pacific, while many hosts deliver between 800 ms to 1200 ms for the same visitors.
Agencies managing client sites should choose WP Engine because of the 100% uptime and 65ms global TTFB that ensures client sites load fast worldwide.
Ecommerce stores that need consistent speed and uptime should choose WP Engine as the host recorded a TTFB of 355 ms and 100% uptime, which largely reduces cart abandonment risk. Besides, WP Engine’s load handling of 27 ms/0% ensures zero failed requests during traffic surges.
Users who want exceptionally easy WordPress management should choose WP Engine as the host handles WordPress management for you with core, updates, security patching and automatic backups. WP Engine’s 100% uptime reduces the operational burden of monitoring.
Mission critical websites that can’t tolerate downtime at all must choose WP Engine since the host recorded perfect 100% uptime across our 8-month window and also has a history of consistent uptime. The host recorded a downtime of just 25 minutes in the 2025 full year.
Who Should Not Use WP Engine
Budget conscious users and beginners should not choose WP Engine since the pricing starts from $27 per month and the same Startup plan renews at $35 per month. This is 7x the cost of Hostinger Business, which cost only $3.69 per month.
Over three years, WP Engine will cost $1,164 while Hostinger Business will cost $452, a difference of $712. For personal blogs, hobby sites or portfolio pages, there isn’t any noticeable experience gap for visitors between the two hosts.
Users who need email hosting should not choose WP Engine as it offers no email hosting at all, not even as a paid addon. Adding Google Workspace will cost you another $7 per month on top of $27 per month, taking the total cost to $34 per month for a single site, which in some cases, may go up to $39 per month. On the contrary, there are hosts like GreenGeeks for $2.95 per month, renewing at $13.95, that include email hosting for no additional cost.
Sites that need heavy server resources like WooCommerce stores, and plugin heavy sites should not choose WP Engine since the host has a low WPBench score of 6.5, which indicates restricted CPU and RAM allocation on the Startup plan while hosts like Kinsta with 8.8 offer more raw power.
Our Verdict
WP Engine scored 9.57 out of 10 on performance across our 8-month monitoring window. We recommend WP Engine for users who need excellent global performance, easy WordPress management, and are okay with the $27 per month premium for a single site. All WP Engine plans come with edge CDN, daily backups, one click staging, Genesis themes, and 60 day money back guarantee. WP Engine does not come with email hosting and adding Google Workspace or similar will cost between $7 to $12 per month.
We don’t recommend WP Engine for users who are budget sensitive, need email or need heavy server resources for complex database heavy sites. WP Engine historical data has shown an excellent improvement of 23% in TTFB from 463 ms in 2024 to 355 ms across our current window after a 3 year decline.
If you are looking for the single best alternative for budget, it’s the Hostinger Business plan with a performance score of 8.35 out of 10 and a global TTFB of 351 ms for $3.69 per month, renewing at $16.99. WP Engine starts at $27 per month for the Startup plan and the same plan renews at $35 per month, which is a 30% increase from the intro price. We wrote this review based on 3,011,040 performance tests conducted between 2020 and May 2026 using tools such as Pingdom, Loader.io, SpeedVitals and WPBenchmark.
For a budget alternative, you can go with Hostinger Business for $3.69 per month and a performance score of 8.35. For a premium alternative, Pressable would be an ideal host for $20.83 per month with a performance score of 9.66. The host costs $6 per month less than WP Engine. Pressable is the most direct upgrade from WP Engine.
Methodology
We purchase all hosting accounts using our own funds and none of them is a promotional or press account. The tools we use to conduct and monitor comprise Pingdom for TTFB and uptime monitoring every 60 seconds across 19 US locations, Loader.io for load testing, SpeedVitals for testing global TTFB in over 40 cities and WPBenchmark for testing server hardware with 21 tests across 5 categories.
We conduct 525,600 tests per host per year at one check every 60 seconds, 24/7/365. The performance score shown in this review is the same score published in the performance data table on our best WordPress hosting page, where the full scoring bands are documented.
The data period for this review is October 1, 2025 to May 31, 2026, i.e 243 days of monitoring and 349,920 individual checks. We used the historical data from 2020 to the current data period for WP Engine with 2,091 days of data. We tested 34 providers.
For the complete details on every test, scoring threshold, and methodology decision, see our full methodology page.