This is a complete set of Core Web Vitals statistics for 2026, rebuilt from the June 2026 HTTP Archive crawl of the Chrome User Experience Report. Every figure below comes from real Chrome users visiting 4,472,428 WordPress origins with 1,677,059 on desktop and 2,795,369 on mobile, alongside eight competing platforms, eight WordPress hosts, seven page builders and 236 countries. We also compare this field data against our own controlled hosting tests, which have run continuously since 2020.
HTTP Archive · Chrome UX Report · June 2026
Core Web Vitals: WordPress against eight competing platforms
WordPress passes Core Web Vitals on 53.3% of desktop origins and 48.8% of mobile origins, placing it 8th of the nine platforms measured. Server response time is the metric holding the rest back, and it is the only one the site owner buys rather than builds.
18.2% in 2020. 8th of 9.
14.9% in 2020. Gain of 33.9pp.
26.0% in 2020. Gain of 7.2pp.
Strongest metric. Mobile 90.9%.
82.6% fully hosted vs 41.1% self-hosted.
June 2026 crawl.
Nine platforms, ranked by desktop Core Web Vitals
TTFB is not itself a Core Web Vital, but it sets the floor for every other metric. Platforms that ship edge caching by default clear it. Platforms where the buyer picks the server do not — the four self-hosted platforms occupy four of the bottom five TTFB positions.
| Platform | Hosting model | Desktop CWV | Mobile CWV | Mobile gap | Good TTFB | TTFB rating | |
|---|---|---|---|---|---|---|---|
| Wix | Fully hosted | 87.1% | 80.1% | −7.0pp | 61.6% | Average | |
| Duda | Fully hosted | 86.7% | 85.5% | −1.2pp | 84.5% | Strong | |
| Webflow | Fully hosted | 81.0% | 68.1% | −12.9pp | 78.9% | Strong | |
| Shopify | Fully hosted | 78.8% | 76.5% | −2.3pp | 93.1% | Elite | |
| Squarespace | Fully hosted | 71.1% | 70.1% | −1.0pp | 95.1% | Elite | |
| Drupal | Self-hosted | 64.6% | 63.9% | −0.7pp | 59.3% | Average | |
| Joomla | Self-hosted | 59.1% | 57.0% | −2.1pp | 49.7% | Below Avg | |
| WordPress | Self-hosted | 53.3% | 48.8% | −4.5pp | 33.2% | Below Avg | |
| Magento | Self-hosted | 43.6% | 44.3% | +0.7pp | 22.4% | Poor |
WordPress by metric
Share of WordPress origins passing, June 2026, against the June 2020 baseline.
| Metric | Desktop | Mobile | Mobile gap | Since 2020 | Rating |
|---|---|---|---|---|---|
| INP Interactivity | 99.2% | 90.9%56.0% in 2022 | −8.3pp | New metricReplaced FID, Mar 2024 | Elite |
| CLS Visual stability | 73.9% | 87.2% | +13.3pp | +26.7ppfrom 47.2% | Strong |
| LCP Loading speed | 69.3% | 55.7% | −13.6pp | +37.5ppfrom 31.8% | Strong |
| FCP First paint | 61.2% | 43.7% | −17.5pp | +32.0ppfrom 29.2% | Average |
| TTFB Server response | 33.2% | 24.2% | −9.0pp | +7.2ppfrom 26.0% | Below Avg |
| All CWV Combined pass | 53.3% | 48.8% | −4.5pp | +35.1ppfrom 18.2% | Average |
Where the variable actually sits
Two cuts of the same data: WordPress against itself, then hosting model against hosting model.
Good desktop TTFB — same CMS, two populations
Identical software, different servers. The variable is hosting, not WordPress.
| Group mean | Fully hosted (5) | Self-hosted (4) | Gap |
|---|---|---|---|
| Good TTFB | 82.6% | 41.1% | 41.5pp |
| Desktop CWV | 80.9% | 55.1% | 25.8pp |
| Mobile CWV | 76.1% | 53.5% | 22.6pp |
Source: HTTP Archive Tech Report, drawing on the Chrome User Experience Report, June 2026 crawl — 4,472,428 WordPress origins. Fully hosted: Wix, Duda, Webflow, Shopify, Squarespace. Self-hosted: Drupal, Joomla, WordPress, Magento. Group means are unweighted averages of the platform figures shown above. Ratings: pass rates map to the Hostingstep tier scale — Elite 90% and above, Strong 70–89.9%, Average 50–69.9%, Below Average 30–49.9%, Poor under 30%.
Key Core Web Vitals Statistics for 2026
Every figure in this list comes from the June 2026 HTTP Archive crawl of the Chrome User Experience Report, which records what real Chrome users experienced over the preceding 28 days.
- 53.3% of WordPress origins pass Core Web Vitals on desktop and 48.8% pass on mobile, measured across 1,677,059 desktop and 2,795,369 mobile origins.
- WordPress desktop pass rates have risen from 18.2% in June 2020 to 53.3% in June 2026, a gain of 35.1 percentage points across six years of monthly data.
- Only 33.2% of WordPress origins record a good desktop TTFB (under 800ms), and just 24.2% do so on mobile. TTFB has improved by 7.2 percentage points since 2020, while every other metric gained between 26 and 38 points.
- Among the top 100,000 WordPress sites by traffic, 63.3% record a good desktop TTFB — nearly double the rate across all WordPress origins.
- Wix is now the fastest CMS by Core Web Vitals, with 87.1% of desktop origins passing, ahead of Duda at 86.7% and Webflow at 81.0%. WordPress ranks eighth of the nine platforms measured.
- Squarespace records the strongest server response of any platform, with 95.1% of desktop origins achieving a good TTFB, followed by Shopify at 93.1%.
- 99.2% of WordPress desktop origins pass INP, the interactivity metric that replaced First Input Delay in March 2024. Mobile INP passes on 90.9% of origins.
- WordPress mobile CLS (87.2%) outperforms desktop CLS (73.9%) by 13.3 points — the only metric where mobile beats desktop.
- Sites on WP Engine record the highest Core Web Vitals pass rate of any major WordPress host at 68.0% desktop, ahead of Kinsta at 64.7%.
- Sites built with Bricks pass Core Web Vitals at 60.9% on desktop, against 31.6% for Divi — a 29.3-point spread between the strongest and weakest page builders.
- Origins behind Cloudflare record a 58.3% good desktop TTFB against 33.2% for WordPress overall, a 25.1-point difference.
- Estonia leads all countries with 78.3% of WordPress mobile origins passing Core Web Vitals. Nigeria records the lowest at 4.4%, and India reaches 27.6%.
- In the United States, 62.9% of WordPress mobile origins pass Core Web Vitals, against 66.6% in the United Kingdom and 72.3% in Japan.
- The median WordPress mobile page weighs 2.64 MB, of which 677 KB is JavaScript and 1,015 KB is images.
- WordPress records a median mobile Lighthouse performance score of 44 out of 100, against 62 for Wix and 30 for Squarespace.
How WordPress Core Web Vitals Have Changed Since 2020
We pulled the June snapshot for every year from 2020 through 2026 to remove seasonal variation. The pattern is consistent and it points in one direction.

| June | Overall (desktop) | Overall (mobile) | LCP (desktop) | CLS (desktop) | TTFB (desktop) |
|---|---|---|---|---|---|
| 2020 | 18.2% | 14.9% | 31.8% | 47.2% | 26.0% |
| 2021 | 25.0% | 18.9% | 39.4% | 58.0% | 29.2% |
| 2022 | 30.1% | 29.6% | 45.5% | 61.1% | 31.1% |
| 2023 | 36.5% | 31.7% | 53.3% | 63.7% | 34.6% |
| 2024 | 45.0% | 39.7% | 60.8% | 70.0% | 33.1% |
| 2025 | 48.9% | 43.4% | 65.2% | 71.4% | 31.6% |
| 2026 | 53.3% | 48.8% | 69.3% | 73.9% | 33.2% |
LCP gained 37.5 points across the period. CLS gained 26.7. The overall pass rate almost tripled. TTFB gained 7.2 points and has moved sideways since 2023, falling in both 2024 and 2025 before recovering slightly this year.
That divergence matters because the metrics that improved are the ones site owners control through themes, image handling and plugins. The metric that stalled is the one determined by the server, and by the hosting plan sitting underneath it. Six years of WordPress core performance work, better image formats and lazy loading have moved everything except the part the site owner buys rather than builds.
WordPress Core Web Vitals by Metric
| Metric | Threshold for “good” | Desktop passing | Mobile passing | Origins measured (mobile) |
|---|---|---|---|---|
| INP | 200ms or less | 99.2% | 90.9% | 2,031,330 |
| CLS | 0.1 or less | 73.9% | 87.2% | 2,840,756 |
| LCP | 2.5s or less | 69.3% | 55.7% | 2,801,311 |
| FCP | 1.8s or less | 61.2% | 43.7% | 2,853,655 |
| TTFB | 800ms or less | 33.2% | 24.2% | 2,677,111 |
| All three Core Web Vitals | LCP + INP + CLS | 53.3% | 48.8% | 2,795,369 |
INP is measured on fewer origins than the other metrics because Chrome only reports it for sites that receive enough qualifying interactions. The 99.2% desktop figure therefore describes origins with measurable interaction data, not every WordPress site in the crawl.
Core Web Vitals by WordPress Host
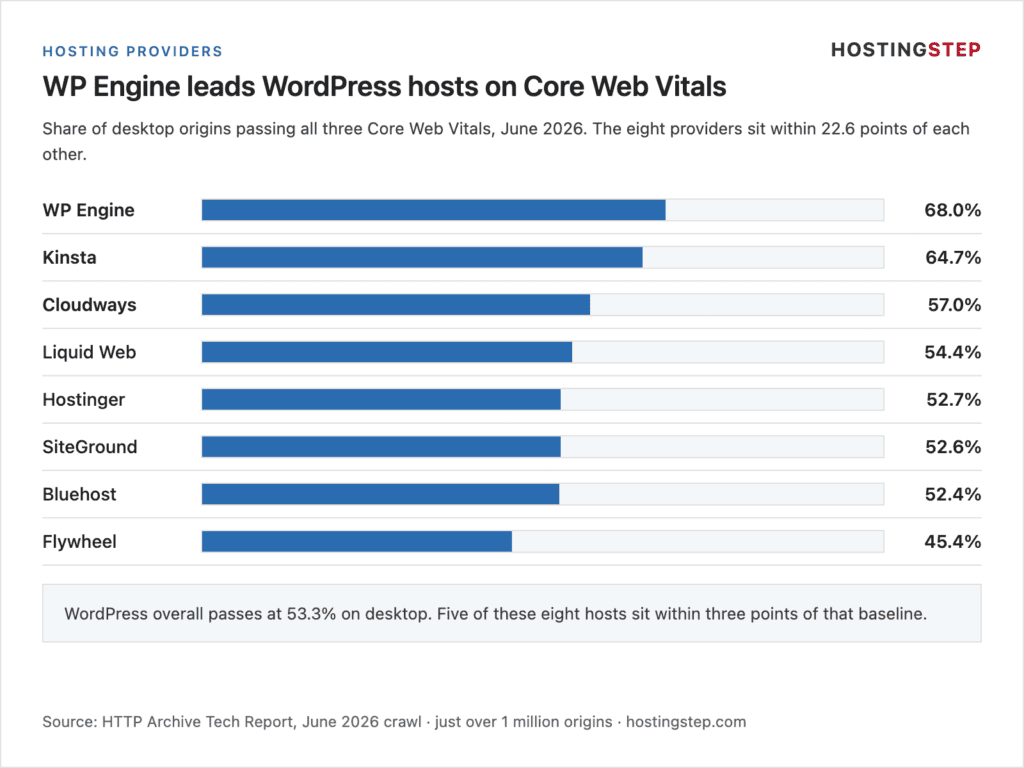
HTTP Archive identifies the hosting provider behind each origin it crawls, which makes it possible to compare Core Web Vitals across WordPress hosts using real visitor data rather than synthetic tests. The table below covers eight providers and just over one million origins in the June 2026 crawl.
| Host | CWV pass (desktop) | CWV pass (mobile) | Good TTFB (desktop) | Origins measured |
|---|---|---|---|---|
| WP Engine | 68.0% | 65.9% | 53.1% | 173,516 |
| Kinsta | 64.7% | 58.4% | 32.8% | 59,459 |
| Cloudways | 57.0% | 55.3% | 36.0% | 35,135 |
| Liquid Web | 54.4% | 48.9% | 42.7% | 6,824 |
| Hostinger | 52.7% | 44.7% | 40.9% | 484,335 |
| SiteGround | 52.6% | 52.7% | 28.4% | 191,306 |
| Bluehost | 52.4% | 41.7% | 34.5% | 63,789 |
| Flywheel | 45.4% | 44.6% | 8.5% | 21,939 |
| WordPress overall: 53.3% desktop, 48.8% mobile, 33.2% good TTFB | ||||
Three findings stand out.
The managed hosts lead, but not by the margin their pricing implies. WP Engine sits 14.7 points above the WordPress average on desktop and Kinsta sits 11.4 points above it. That is a real gap, and it is the clearest evidence in the dataset that hosting quality moves Core Web Vitals. It is also smaller than the price difference between a $20 managed plan and a $3 shared plan would suggest, because a slow theme on fast infrastructure still fails LCP.
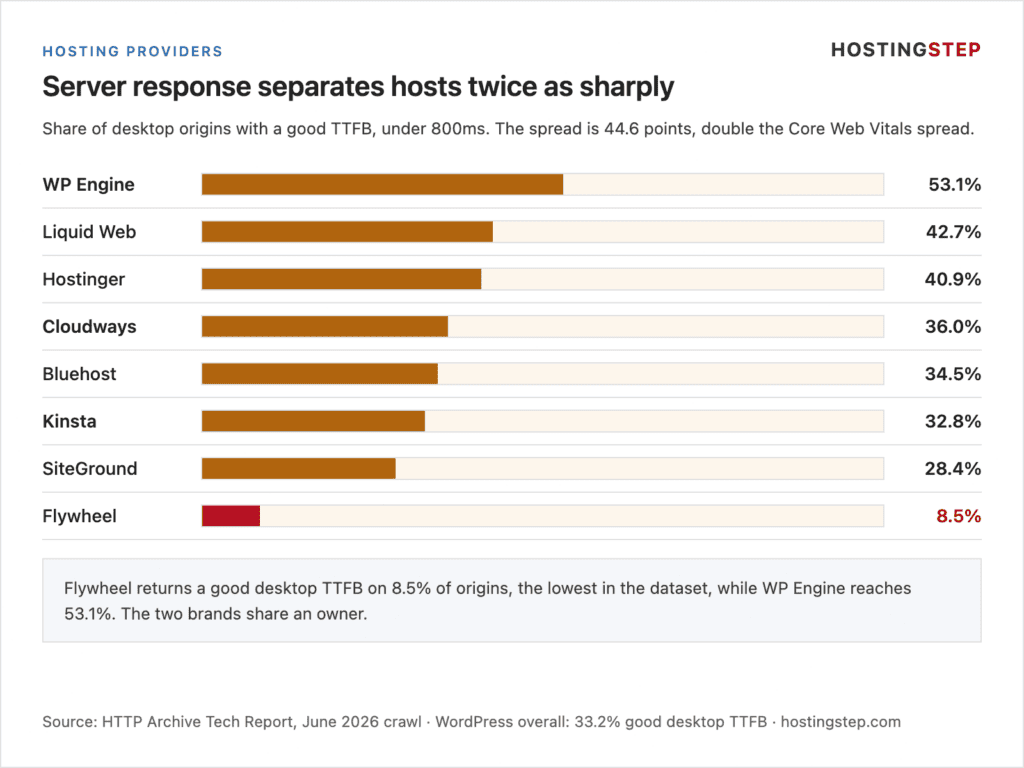
Server response separates hosts more sharply than the headline score. The overall pass rate across these providers spans 22.6 points, from 45.4% to 68.0%. Good TTFB spans 44.6 points, from 8.5% to 53.1%. TTFB is where infrastructure differences actually surface, which is why we monitor it every 60 seconds rather than relying on periodic page tests.
Flywheel’s 8.5% good desktop TTFB is the outlier of the entire dataset. Fewer than one in eleven Flywheel origins returns the first byte within 800ms for desktop visitors, against one in three across WordPress as a whole. Flywheel sits inside the WP Engine group, and the 44.6-point TTFB gap between the two brands is the largest same-owner divergence we found.
Pagely returns 69.1% desktop passing, the highest figure in the category, but from only 1,046 desktop origins. We have excluded it from the table above because samples that small move several points month to month.
Why This Field Data Differs From Our Controlled Tests
The host table above is field data. It measures real Chrome users loading real sites, so every result carries that site’s theme, plugins, image sizes, third-party scripts and visitor geography alongside the server’s own contribution. A host cannot be judged from it in isolation.
Our own testing removes those variables. We buy accounts at 34 hosting providers, never accepting free or promotional plans, and install an identical WordPress site on each. Pingdom then checks every one at 60-second intervals, 1,440 times per day, while SpeedVitals measures global TTFB from 40 locations. The figures below cover October 1, 2025 to May 31, 2026: 243 days, or 349,920 uptime checks per provider.
| Host | Field: good TTFB (HTTP Archive) | Lab: US TTFB (HostingStep) | Lab: global TTFB (HostingStep) |
|---|---|---|---|
| WP Engine | 53.1% | 355ms | 65ms |
| Liquid Web Managed WordPress | 42.7% | 496ms | 349ms |
| Hostinger | 40.9% | 447ms | 404ms |
| Cloudways | 36.0% | 442ms | 386ms |
| Bluehost | 34.5% | 501ms | 224ms |
| Kinsta | 32.8% | 525ms | 477ms |
| SiteGround | 28.4% | 745ms | 1,200ms |
The two methods agree at the extremes and diverge in the middle. SiteGround is last on both, and its 1,200ms global TTFB explains the 28.4% field figure directly. WP Engine leads both. Kinsta is the interesting case: it ranks second on field Core Web Vitals but only sixth on our measured TTFB, which tells you its customers build faster sites rather than that its servers are faster. Bluehost runs the opposite way — competitive infrastructure carrying slower sites.
Read the field column to see what real sites on a host achieve. Read our columns to see what the host itself delivers when the site is held constant. Neither replaces the other. Our complete dataset, including monthly uptime and load-test results for all 34 providers, is published in the WordPress hosting benchmarks.
Core Web Vitals by WordPress Page Builder
Page builders are detected separately from the CMS, so the same crawl reveals how each one performs in the field. This covers 3.05 million origins across seven builders.

| Page builder | CWV pass (desktop) | CWV pass (mobile) | LCP (desktop) | CLS (desktop) | Origins measured |
|---|---|---|---|---|---|
| Bricks | 60.9% | 54.3% | 70.4% | 84.6% | 17,345 |
| Beaver Builder | 58.3% | 53.8% | 71.9% | 79.8% | 54,431 |
| WordPress Block Editor | 57.1% | 53.0% | 73.3% | 75.0% | 922,497 |
| Oxygen | 48.0% | 52.3% | 71.6% | 63.2% | 19,759 |
| Elementor | 43.4% | 36.8% | 55.8% | 73.9% | 1,415,046 |
| WPBakery | 39.2% | 38.7% | 57.7% | 64.9% | 372,913 |
| Divi | 31.6% | 42.7% | 60.1% | 49.5% | 245,984 |
The spread between the strongest and weakest builder is 29.3 points on desktop, wider than the spread between WordPress hosts. Bricks leads at 60.9%, and the native Block Editor sits close behind at 57.1% across 922,497 origins, which is a far larger sample than any commercial builder except Elementor.
Divi’s 31.6% desktop pass rate is 21.7 points below the WordPress average, driven almost entirely by layout stability: only 49.5% of Divi origins record a good desktop CLS, the lowest figure of any technology in this study. Divi is the one builder that performs better on mobile (42.7%) than desktop (31.6%), which points at desktop-specific layout behaviour rather than payload weight.
Elementor carries the largest footprint at 1.42 million origins and passes at 43.4% desktop and 36.8% mobile. Its mobile figure is the weakest in the table. Note that these are correlations across millions of independently built sites, not controlled comparisons — builders that attract non-technical users will inherit the consequences of that audience.
Caching Plugins and CDN: Core Web Vitals Impact
Caching plugins and CDNs are also detected in the crawl, which allows the same comparison across performance tooling.
| Technology | CWV pass (desktop) | CWV pass (mobile) | Good TTFB (desktop) | Origins measured |
|---|---|---|---|---|
| Cloudflare (CDN) | 58.8% | 50.8% | 58.3% | 6,532,800 |
| NitroPack | 57.6% | 57.7% | 32.6% | 23,697 |
| FlyingPress | 56.0% | 54.8% | 33.7% | 6,929 |
| Perfmatters | 56.0% | 51.4% | 32.4% | 31,692 |
| WP Rocket | 53.2% | 52.3% | 32.4% | 494,157 |
| LiteSpeed Cache | 51.6% | 50.5% | 33.6% | 593,387 |
| WP Super Cache | 51.1% | 46.9% | 28.7% | 134,456 |
| W3 Total Cache | 47.6% | 44.2% | 27.0% | 138,391 |
The gap between the best and worst caching plugin is 11.2 points, roughly a third of the gap between page builders. Every caching plugin in the table clusters between 27% and 34% good TTFB, which is the WordPress average. That is the expected result: a caching plugin serves a cached page from the same server, so it shortens processing time but does not shorten the distance to the visitor.
Cloudflare is the exception at 58.3% good desktop TTFB, 25.1 points above the WordPress baseline, because it answers from an edge location rather than the origin server. This is the same mechanism that puts Squarespace at 95.1% and Shopify at 93.1% — those platforms ship edge delivery as a default, whereas a WordPress site owner has to add it.
Core Web Vitals by Country
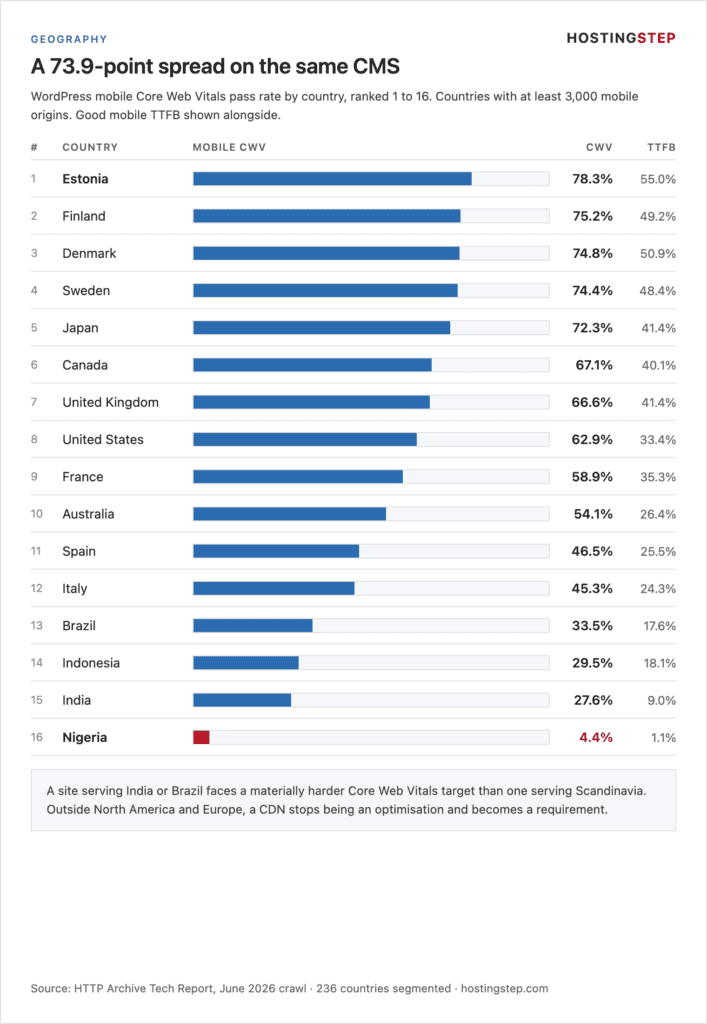
HTTP Archive segments Core Web Vitals across 236 countries. The variation is wider than any technology comparison in this study.
| Country | CWV pass (mobile) | CWV pass (desktop) | Good TTFB (mobile) |
|---|---|---|---|
| Estonia | 78.3% | 77.7% | 55.0% |
| Finland | 75.2% | 76.9% | 49.2% |
| Denmark | 74.8% | 72.3% | 50.9% |
| Sweden | 74.4% | 74.6% | 48.4% |
| Japan | 72.3% | 77.8% | 41.4% |
| Canada | 67.1% | 64.3% | 40.1% |
| United Kingdom | 66.6% | 66.5% | 41.4% |
| Germany | 62.9% | 69.4% | 35.1% |
| United States | 62.9% | 64.9% | 33.4% |
| France | 58.9% | 64.9% | 35.3% |
| Australia | 54.1% | 56.6% | 26.4% |
| Spain | 46.5% | 55.4% | 25.5% |
| Italy | 45.3% | 58.7% | 24.3% |
| Brazil | 33.5% | 50.2% | 17.6% |
| Indonesia | 29.5% | 44.4% | 18.1% |
| India | 27.6% | 38.7% | 9.0% |
| Nigeria | 4.4% | 10.2% | 1.1% |
The range runs from 78.3% in Estonia to 4.4% in Nigeria — a 73.9-point spread on the same CMS. Mobile TTFB tracks it closely, from 55.0% in Estonia to 1.1% in Nigeria, which is the strongest single correlation in the study and reflects network infrastructure and server proximity rather than anything site owners are doing differently.
The practical consequence is that a site serving India or Brazil faces a materially harder Core Web Vitals target than one serving Scandinavia. If a meaningful share of your traffic sits outside North America and Europe, a CDN stops being an optimisation and becomes a requirement.
Page Weight and Lighthouse Scores by Platform
Core Web Vitals describe what visitors experienced. Page weight and Lighthouse scores describe what the page shipped, measured in the same crawl.
| Platform | Median mobile page | JavaScript | Images | Lighthouse performance (mobile) |
|---|---|---|---|---|
| Drupal | 2.32 MB | 657 KB | 840 KB | 48 |
| Wix | 2.53 MB | 1,638 KB | 182 KB | 62 |
| WordPress | 2.64 MB | 677 KB | 1,015 KB | 44 |
| Squarespace | 3.60 MB | 1,572 KB | 1,038 KB | 30 |
| Shopify | 3.67 MB | 2,079 KB | 735 KB | 47 |
WordPress ships the second-lightest median page of the five platforms and the second-smallest JavaScript payload, yet records the second-lowest Lighthouse performance score and the weakest Core Web Vitals of the group. Shopify ships 3.1 times more JavaScript than WordPress and still passes Core Web Vitals at 78.8% desktop against WordPress at 53.3%.
Images are where WordPress carries the most weight, at 1,015 KB per median mobile page against 182 KB for Wix. Wix resizes and re-encodes every upload through its own pipeline; WordPress serves what the site owner uploaded unless a plugin intervenes.
What Core Web Vitals Measure in 2026
Google assesses a page against three metrics, and a site passes only when the 75th percentile of visits clears all three. First Input Delay was retired in March 2024 and replaced by Interaction to Next Paint.
- Largest Contentful Paint (LCP) measures how long the largest visible element — usually a hero image, video or heading block — takes to render. Good is 2.5 seconds or less. 69.3% of WordPress desktop origins clear it.
- Interaction to Next Paint (INP) measures how quickly the page responds visually to clicks, taps and key presses, across the whole visit rather than just the first interaction. Good is 200 milliseconds or less. 99.2% of WordPress desktop origins clear it.
- Cumulative Layout Shift (CLS) measures how much visible content moves while the page loads. It is a unitless score, and good is 0.1 or less. 73.9% of WordPress desktop origins clear it.
Time to First Byte is not a Core Web Vital. Google treats it as a diagnostic metric, with 800 milliseconds or less counted as good. It matters because it is the floor under LCP: a page that takes 900ms to return its first byte has already spent more than a third of its LCP budget before the browser has parsed anything. This is why TTFB carries the weight it does throughout this study, and why it is the metric we monitor continuously across all 34 hosts we test.
Methodology
Field data. All Core Web Vitals figures come from the HTTP Archive Tech Report, which aggregates the Chrome User Experience Report. CrUX records what real Chrome users experienced over a rolling 28-day window, segmented by technology, country and traffic rank. This study uses the June 2026 crawl, the most recent complete dataset available at the time of writing. CrUX publishes roughly two months in arrears; we will update this page with July 2026 figures as soon as they are released.
Technology attribution is performed by fingerprinting the crawled page. A site is counted under a host, page builder or plugin when that technology is detected in its response. Origin counts differ by metric because Chrome only reports a metric when it has sufficient samples, which is why INP is measured on fewer origins than LCP or CLS.
What field data cannot tell you. Every figure segmented by host, builder or plugin reflects the sites using that technology, not the technology in isolation. A host serving image-heavy sites built by non-technical owners will score below one serving lean sites built by agencies, regardless of its infrastructure. These are correlations across millions of independently built sites, and we have flagged the cases where sample size or attribution makes a figure unreliable rather than publishing it.
Our controlled data. The comparison in this study uses accounts we purchased at 34 hosting providers, never free or promotional plans, each running an identical WordPress installation. Pingdom checks each site at 60-second intervals, producing 1,440 tests per day per host. SpeedVitals measures cached global TTFB from 40 worldwide locations, and Loader.io measures behaviour under concurrent load. The window quoted here runs from October 1, 2025 to May 31, 2026, covering 243 days and 349,920 uptime checks per provider.
Sources
- HTTP Archive Tech Report — Core Web Vitals, page weight, Lighthouse and adoption data, June 2026 crawl
- Chrome User Experience Report — underlying field measurement dataset
- web.dev — Core Web Vitals thresholds and the March 2024 transition from FID to INP
- HostingStep WordPress hosting benchmarks — our continuous monitoring data across 34 providers